You start setting up the diagram by assigning the scope of the x- and y-axis.
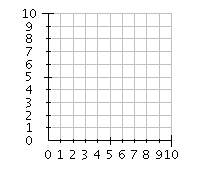
If you indicate a value of 10:
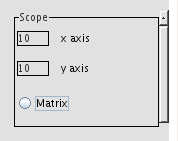
it will produce this:
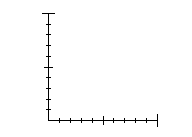
You start setting up the diagram by assigning the scope of the x- and y-axis.
If you indicate a value of 10:
it will produce this:
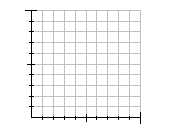
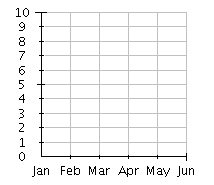
If you enable the grid checkbox:
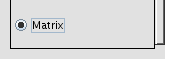
it will give you this:
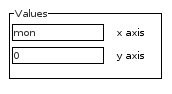
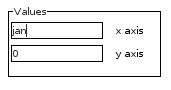
Here you put values to an axis. There are, at this point, four different possible formats: numbers, days, months, and time. You just assigne the first value in the scale. The program then uses the scope value to calculate the rest of the scale.
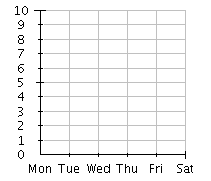
If you indicate the first value to zero (0):
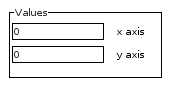
it will produce this:
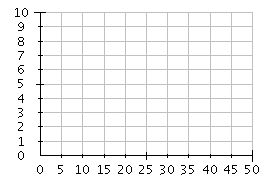
You can also change the interval between the units. You do so, and this is extremly importent, by hitting the space key then the plus sign and then a space again and last the value of the interval. (This only works for numbers).
The exact format for this is:
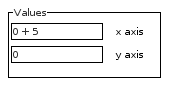
it will produce this:
If you want to use the day, month or time format, you just type in the initial day, month or time in the scale, and then the program calculate the rest.
IMPORTANT! You shall only type in the first three letters for days and months, it's the only valid format. Anything else will be interpret as not valid input.
Just type the first day:
it will produce this:
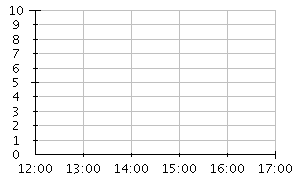
You can start on any day, month or time:
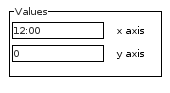
and the result will be:
Month's will look like this:
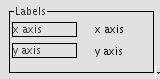
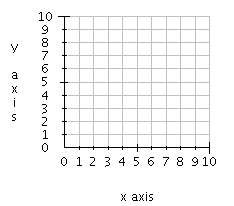
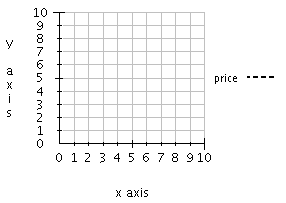
Here you can give a label to the x and y axis:
Here is were you create your graphs. You have to create one before you can plot it. Just choose color and style, and optionally a label. Then hit the 'New' button.
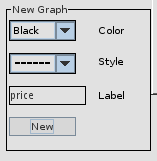
Now you can start plotting your graph.
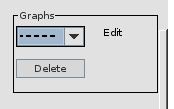
Here you can see all your created graphs. Choose one from the dropdown list to edit(see the 'undo' button in the section below) or delete it. When you create a new graph it will always be the active one.
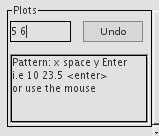
You can do the plotting with the mouse or with this input field. Type in the x and y values separated with a whitespace, and then hit enter. Both integers and floating pionts are valid.
The input field only accept digits, so you can't type in the day, month and time format. In these formats, the first value is always asumed to be one(1). Then it increases with one through the scale, so you have to keep track of the rest of the values in the scale. This can be a little tricky, therfore it's recomeded to use the mouse to plot with these formats.
The reason for this is that if you, for example, have a scope of 15 and have indicated days as values starting with monday, you will have three mondays. How to let the program know wich of these three mondays you mean when you type it in is not yet solved.
The 'Undo' botton simply deletes the last plot in the active graph.
With the save function it's possible to save a graph as a jpeg image or as a json file. The json is possible to open again with the open button. You can manually make changes to the json and it will work in the application, but be carefully with what you do. Make sure you follow the json structure, it will be validated against a templet on the server side, and don't change data points you don't understand what they mean. Otherwhise the result may be unpredictable.
If it doesn't work to open a json and there is no error message, clean the browser cache and try again. Sometimes you may have to try a couple of times.
The data points in the json should be quite self explanatory, and it can be fun to experiment with the values to see if it works. It's not guaranteed it will.